Perplejidad para medir relevancia de textos en un contexto específico
La perplejidad es una medida estadística de cuán confiadamente un modelo de lenguaje pre entrenado predice un texto. En otras palabras, la perplejidad cuantifica qué tan «sorprendido» está el modelo cuando ve nuevos datos. Cuanto menor sea la perplejidad, mejor será el modelo en predecir el texto (o el texto está más relacionado con el […]
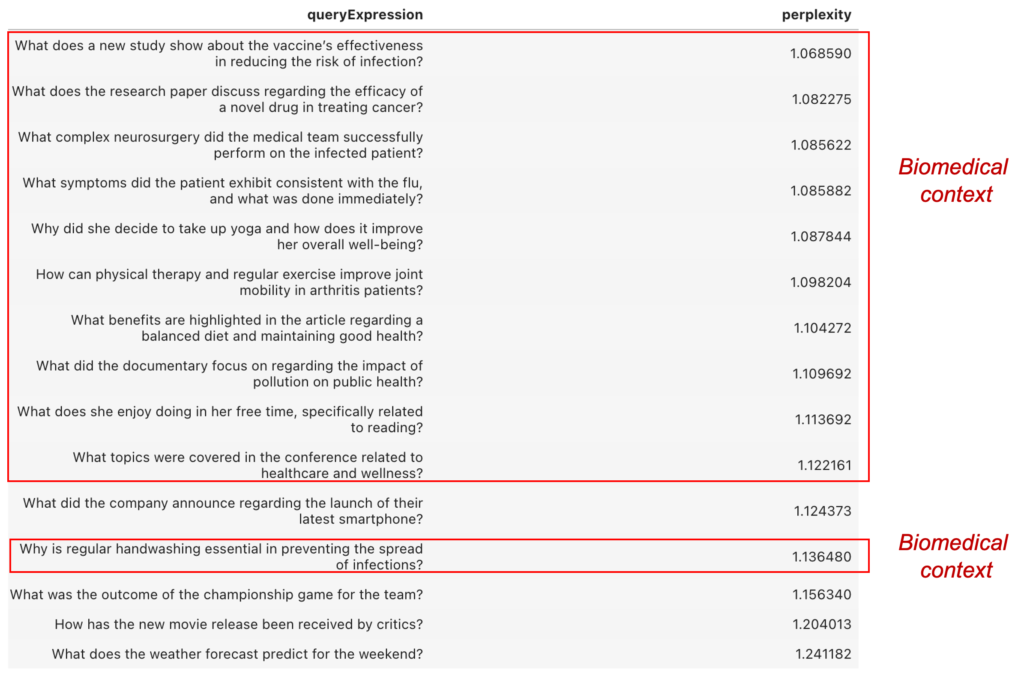
Perplexity: assessing the relevance of a text within a context

Perplexity is a statistical indicator that gauges the level of certainty a language model possesses in predicting text. This measurement essentially quantifies the model’s degree of «surprise» when it encounters previously unseen data. When the perplexity value decreases, it signifies an improved predictive prowess of the model, pointing to a more cohesive correspondence between the […]
Pandas vs Polars
__temp__ Pandas vs Polars¶ In this notebook, we compare the performance of Pandas and Polars in handling data. Pandas is a popular data manipulation library for Python, while Polars is a newer data processing library that is optimized for performance. To compare the performance of the two libraries, we have created two functions that perform […]
Motion Chart with Plotly
Motion Chart with Plotly This is a concise script for creating a motion chart using Python and Plotly Express. The script loads the ‘gapminder’ dataset, which contains information about the GDP per capita, life expectancy, population, and continent for various countries around the world. The script then creates a bubble chart using the data, with […]
Performing NER with Pre-Trained Models
NER-Copy1 Get started with NER models¶ Named Entity Recognition (NER) is a vital task in NLP that involves identifying and extracting named entities from text. It has many real-world applications, such as information extraction, question answering, and sentiment analysis. Pre-trained NER models are available from popular NLP libraries like Spacy, Hugging Face, and NLTK. In […]
Optimization using Optuna

optuna Optimization using Optuna¶ The following article presents an example of how to find the best hyperparameters to train a random forest using the optuna library. In [10]: import optuna import seaborn as sns from sklearn.ensemble import RandomForestClassifier from sklearn.model_selection import train_test_split Load and split Data¶ In [4]: # Load the iris dataset from Seaborn iris = […]
Benford’s Law (Part 1)
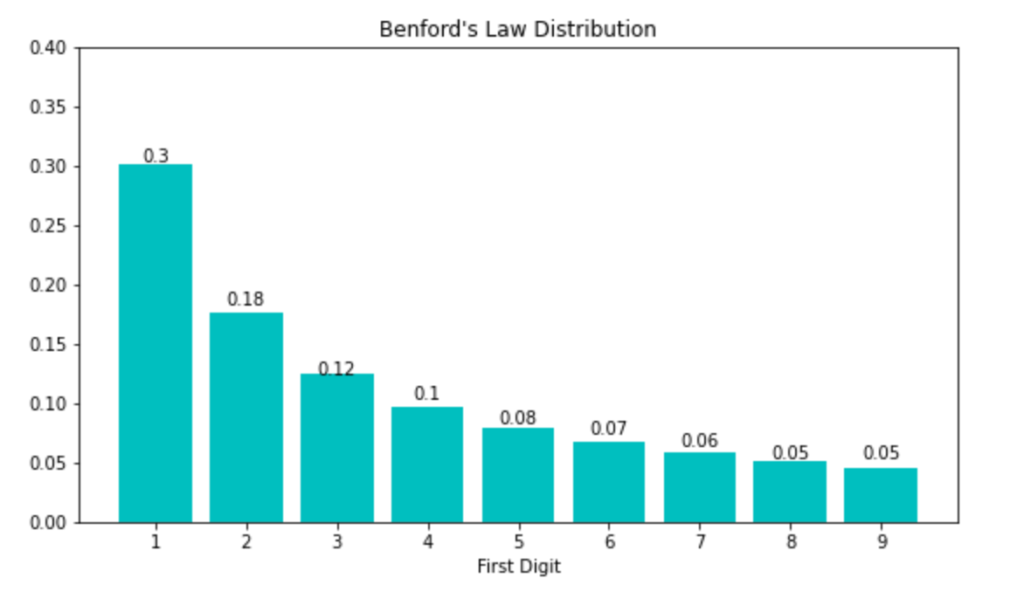
Benford_Law Benford’s Law Introduction¶ What is Benford’s?¶ Benford’s Law is a statistical phenomenon that describes the distribution of leading digits in many naturally occurring datasets. The law states that the first digit in a random dataset is more likely to be small (e.g., 1, 2, or 3) than large (e.g., 8 or 9). This pattern […]
R-Tidyverse vs Python-Pandas
Data transformation is a crucial step in the data analysis process, and it is the process of converting raw data into a format that is more suitable for analysis. Two popular tools for data transformation are R-tidyverse and Python-pandas. Both of these tools are widely used by data scientists and analysts, but they have different […]
Delincuencia en República Dominicana (Dataset)

En este artículo se publica un conjunto de datos (dataset) con estadísticas de casos sometidos a la Procuraduría General de la República Dominicana, publicados en este link: https://transparencia.pgr.gob.do/Inicio/i/5698_Estad%c3%adsticas_de_Casos_Sometidos Estos datos cubren 113112 casos sometidos desde enero de 2017 hasta octubre de 2022. Adicionalmente, el equipo de ML4Data creó dos nuevos campos que recategorizan la provincia […]
Overfit with random data
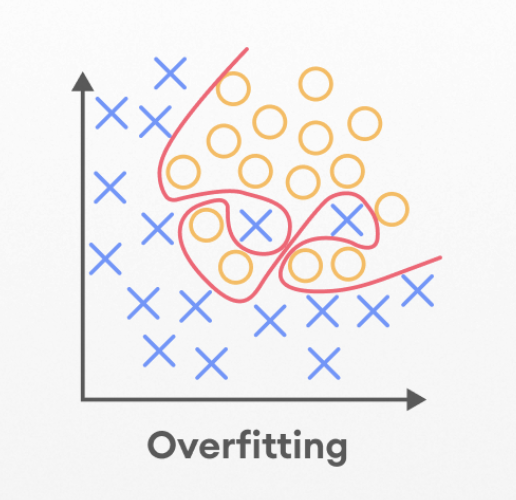
Machine learning algorithms are designed to learn patterns from a dataset and make predictions based on those patterns. If an algorithm is trained on a dataset that has too much noise, it may develop a model that is not able to generalize well to new data. This is known as overfitting. One way (not […]