Benford’s Law Introduction
What is Benford’s?
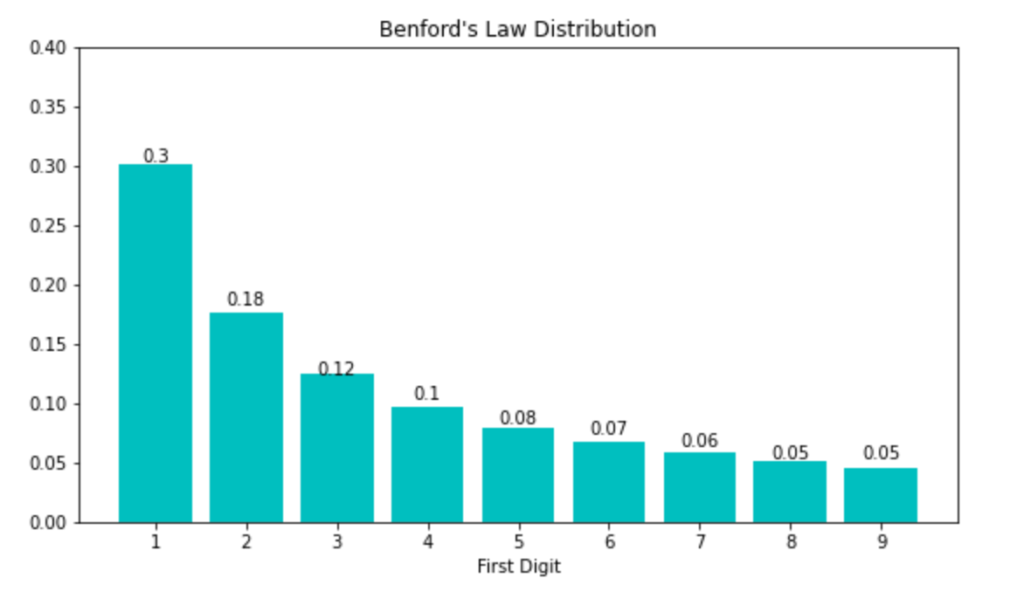
Benford’s Law is a statistical phenomenon that describes the distribution of leading digits in many naturally occurring datasets. The law states that the first digit in a random dataset is more likely to be small (e.g., 1, 2, or 3) than large (e.g., 8 or 9). This pattern is observed in a wide range of data sets, including stock prices, geographic data, scientific measurements, and financial transactions.
For example, the probability of the first digit being 1 is around 30%, while the probability of it being 9 is only 5%. This distribution of first digits occurs in many naturally occurring datasets, including financial statements, population statistics, scientific data, and more.
Benford’s Law formula
The formula is given as: P(d) = log10(1 + 1/d) and can be expressed as:
\begin{equation*}
\begin{aligned}
&P(d) = \log_{10}\left(1 + \frac{1}{d}\right), \
&d \in {1, 2, …, 9}
\end{aligned}
\end{equation*}
Where P(d) is the probability that the first digit in a number is d, and d is any integer between 1 and 9. This formula shows that the probability of observing a small digit as the first digit is much higher than observing a large digit.
In simpler terms, the formula suggests that the first digit of numbers in many naturally occurring datasets is not uniformly distributed, but instead follows a predictable pattern. This pattern is characterized by a high frequency of smaller digits (1, 2, 3), and a low frequency of larger digits (7, 8, 9).
Python code
Here’s a simple Python code to calculate the Benford’s Law formula for a given number:
import numpy as np
import matplotlib.pyplot as plt
def benfords_law(x):
    return np.log10(1 + 1 / x)
x = np.arange(1, 10)
y = benfords_law(x)
fig, ax = plt.subplots(figsize=(9, 5))
bars = ax.bar(x, y, color='c')
plt.title("Benford's Law Distribution")
plt.xlabel("First Digit")
plt.ylim([0, 0.4])
plt.xticks(x)
for bar in bars:
    h = bar.get_height().round(2)
    ax.text(bar.get_x()+bar.get_width()/2, h, h, ha='center', va='bottom')
plt.show()

Validation of Benford’s law on different data sets
The next example defines functions to apply Benford’s Law to a pandas DataFrame, which is a statistical phenomenon that describes the frequency distribution of the first digits of many naturally occurring datasets.
The get_first_digits() function extracts the first digit of each value in the input data, while the calculate_frequency() function calculates the frequency of each digit in the extracted first digits.
The calculate_benford_freq() function calculates the expected frequency of each digit according to Benford’s Law, and the plot_benford_law() function generates a bar chart that compares the observed frequency of each digit in the data with the expected frequency according to Benford’s Law.
import pandas as pd
import numpy as np
import matplotlib.pyplot as plt
def get_first_digits(data):
    return [int(str(i)[0]) for i in data.values.flatten() if str(i)[0].isdigit()]
def calculate_frequency(first_digits):
    freq = np.zeros(9)
    for i in range(1,10):
        freq[i-1] = sum([1 for j in first_digits if j==i])
    return freq
def calculate_benford_freq():
    return [np.log10(1 + 1/d) for d in range(1,10)]
def plot_benford_law(data, ds_name):
    first_digits = get_first_digits(data)
    freq = calculate_frequency(first_digits)
    benford_freq = calculate_benford_freq()
    plt.figure(figsize=(10, 5))
    plt.bar(range(1,10), freq/sum(freq), label='Observed', alpha=0.5)
    plt.grid(axis='both')
    plt.plot(range(1,10), benford_freq, 'r', label='Expected')
    plt.legend()
    plt.xlabel('First Digit')
    plt.ylabel('Frequency')
    plt.title(f'Benford\'s Law Applied to {ds_name} dataset')
    plt.xticks(range(1,10))
    plt.show()
from sklearn.datasets import load_wine
wine = load_wine()
wine_df = pd.DataFrame(data=wine.data, columns=wine.feature_names)
plot_benford_law(wine_df, 'WINE')

from sklearn.datasets import load_breast_cancer
breast_cancer = load_breast_cancer()
breast_cancer_df = pd.DataFrame(data=breast_cancer.data, columns=breast_cancer.feature_names)
plot_benford_law(breast_cancer_df, 'BREAST CANCER')

from seaborn import load_dataset
pg = load_dataset('attention')
plot_benford_law(pg, 'ATTENTION')

from seaborn import load_dataset
pg = load_dataset('flights')
plot_benford_law(pg, 'FLIGHTS')
